PDGuide - Analyzing Performance and Debugging Problems Using Trace
Reprint Courtesy of International Business Machines Corporation, © International Business Machines Corporation
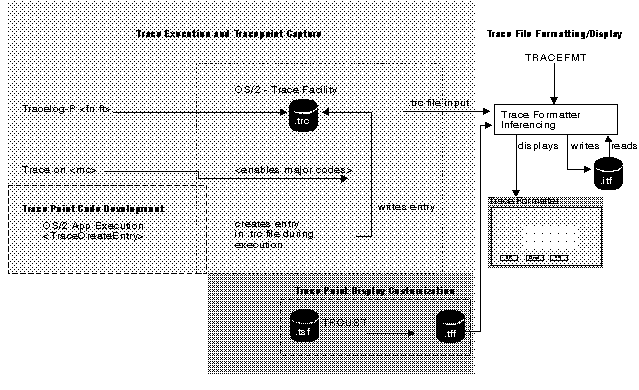
This chapter describes trace and the benefits of the various types of trace points. The chapter contains an overview of instrumenting (setting up) your code to use trace and explains how to display and analyze trace information.
This chapter also describes the following programs that are used to analyze trace information:
- Trace Formatter (TRACEFMT)
- Trace Commands (TRACE and TRACEBUF)
- Trace Customizer (TRCUST)
- Trace Capture (TRACEGET)
TraceFlow
Turning on Trace Points Using the TRACE Command
Use the TRACE command to control (turn on and off) trace points in your product. When you turn on a trace point, the system considers the trace point to be active and stores information for trace point in the trace file.
Refer to OS/2 Warp Version 4 Command Reference for information about using the TRACE command and its parameters.
The following two statements need to be added to your CONFIG.SYS file before you use the TRACE command:
TRACEBUF=x
- x
- is used to set the trace buffer size. Valid values are from 1 to 63 kilobytes (KB). The default size of the buffer is 4 KB.
- TRACE= ON | OFF
- Used to turn trace on or off.
If neither statement (TRACEBUF nor TRACE) is included in the CONFIG.SYS file on your system, trace is disabled.
Trace Scenario
Use the TRACE command to store trace data in the trace buffer. The following list of commands and descriptions define what happens when you use the TRACE command.
Command Entered Description of Function
- TRACE=ON
- Statement added to CONFIG.SYS
- TRACEBUF=4
- Statement added to CONFIG.SYS
- TRCUST TEST.TSF
- Creates trace information for both formatting output text and for controlling dynamic trace. For more information about the TRCUST command and its parameters, refer to the TRCUST document in the Toolkit.
- TRACE ON 240
- Turn trace ON and specify the major code for the trace points to be traced.
- TRACE ON TEST.TDF
- Modifies the .DLL file and starts dynamic trace points in the .DLL file specified in the TEST.TSF file.
- Run your program
- Perform normal system operations TEST
- TRACE OFF
- Use the TRACE command and OFF parameter to end tracing
- TRACEFMT
- Use the TRACEFMT command to format event trace buffer data.
For information about the TRACE and TRACEBUF commands, refer to the OS/2 Warp Version 4 Command Reference.
Saving Trace Data
You save trace point entries that are created within the system trace buffer in the following ways:
- Use TRACE ON to turn on all static trace points
- Use TRACE ON 220 to turn on trace points for major code 220
- Use TRACE ON PRE to turn on the trace points for the PRE grouping. There are several other groupings available.
- Use TRACE ON TEST.TDF to patch the .DLL file named in the TEST.TSF file. TRCUST uses the TEST.TSF file to create the TEST.TDF file. After the .DLL is patched, the system will save trace points when the .DLL is loaded into the system and run.
There are several other combinations of using the TRACE command. Refer to the OS/2 Warp Version 4 Command Reference for more information.
Formatting Trace Data
The system saves collected trace points in the system trace buffer. This buffer can be displayed by using the trace formatter. This section includes descriptions of the execution methods, user interface, supported files, and the formatting of data.
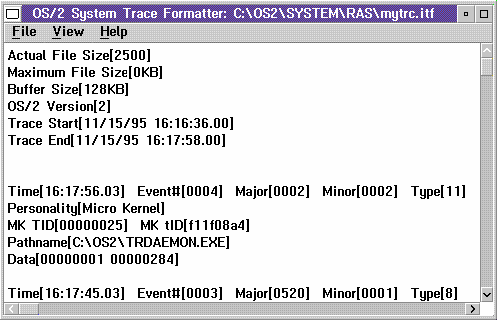
As seen in the example in Trace Format, you can display two types of information when you use the trace formatter. Summary data at the top of the file includes information about the file, trace buffer, and possibly vital product data (VPD). This information changes with each trace file.
The second type of data are the actual trace point entries. Each entry includes the following:
- event number
- timestamp
- major and minor codes
- process ID information
- any optional data saved by the system.
Starting the Trace Formatter
You start the trace formatter by using any of the following methods:
- On an OS/2 command line, type TRACEFMT (followed by an optional trace file name).
- Double-click on the trace formatter program icon.
- Drag and drop the icon for a trace data file onto the trace format program icon.
- Double-click on the icon for a trace data file that is associated with the trace format program.
- Start the trace formatter option from the SYSLOG program or the PMDF program.
Using the Trace Formatter to View, Change, and Analyze Trace Data
This section describes the user interface that the trace formatter uses.
Menu-Bar Choices
The pull-downs available within the trace formatter are:
Trace Format
- File
- Use this pull-down to select a trace file to viewed and what to do to the contents:
- Open
- Used to select a .TRC file to view;
- Save unformatted
- Used to save unformatted trace data to a file usually with the file extension of .itf. The .itf file can be reloaded into the trace formatter.
- Save formatted
- Used to save the contents to a text file (with the extension .FTF for Formatted Trace File). This data can be viewed with an editor such as the system editor.
- Print Setup
- Used to select the output destination of formatted data when you select the Print option. Output can go to either a printer or a file; check the corresponding box to choose the destination. Select a printer name from the drop-down choices or type a file name directly into the field.
- Used to send the currently formatted data to the destination selected in the Printer Setup option.
- Recapture buffer
- Recaptures the current trace buffer and refreshes the display.
- Set .TFF search path
- Set where to look for .TFF trace formatting files to use when you format trace data.
- Exit
- Ends the trace formatter program.
- View
- Allows you to change the view of the trace file contents:
- Select
- Allows a combination of criteria to be selected. You can choose the trace contents important to viewing; this is similar to the SYSLOG Search function as shown in Search Choice. You select the following items in various combinations:
- Major codes
- Minor codes
- Event number
- Process ID
- Time and date
The search combination allows you to build search selections by adding, deleting, or changing conditions before you start the search. In addition, you can save the search values for reuse. The system refreshes the window with the selected contents.
- Display all events
- Cancels the previous Select or summary display and shows all contents.
- Display summary by Process ID
- Displays a sorted listing by process ID
- Display summary by Major Code
- Displays a sorted listing by major code
- Find
- Allows you to search for any particular text in the displayed contents.
- Repeat find
- Repeats the search for the string of text.
- Mark all
- Marks all the text being displayed so you can then copy the text to the clipboard.
- Copy
- Copy the selected text contents to the clipboard. You cannot paste from the clipboard to the trace formatter.
- Fonts
- Select the font used to display formatted data.
- Help
- Using help
- General help on using trace formatter
- General help
- General help on using help
- Keys help
- General help on using trace formatter keys
- Help index
- Index of help key words
- Product Information: Copyright and program information
TRACEGET Command
When you enter the command TRACEGET nnn.trc, the system captures the contents of the trace buffer into the file named nnn.trc. The TRACEGET command is a supplement to the trace formatter. You use the command when the trace formatter cannot be used (such as when a Presentation Manager failure occurs). The file nnn.trc can be saved on removable media and sent to your service organization. You can also copy nnn.trc to another system and use the trace formatter to display the contents of the file.
Summary
This chapter has covered the user interface functions and commands that are associated with trace.
You use trace to understand data and functions both outside and inside of applications. Use this data to correct problems and resolve unwanted conditions.
The trace facility gives you a means to track, save, display, and analyze this diagnostic program data.

