PDGuide - Analyzing Performance and Debugging Problems Using Trace
Reprint Courtesy of International Business Machines Corporation, © International Business Machines Corporation
This chapter describes trace and the benefits of the various types of trace points. The chapter contains an overview of instrumenting (setting up) your code to use trace and explains how to display and analyze trace information.
This chapter also describes the following programs that are used to analyze trace information:
- Trace Formatter (TRACEFMT)
- Trace Commands (TRACE and TRACEBUF)
- Trace Customizer (TRCUST)
- Trace Capture (TRACEGET)
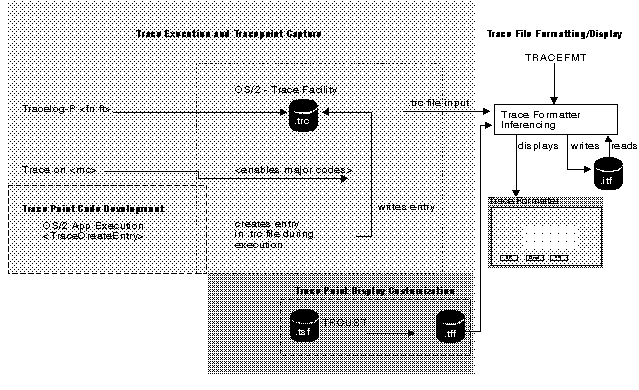
TraceFlow
Turning on Trace Points Using the TRACE Command
Use the TRACE command to control (turn on and off) trace points in your product. When you turn on a trace point, the system considers the trace point to be active and stores information for trace point in the trace file.
Refer to OS/2 Warp Version 4 Command Reference for information about using the TRACE command and its parameters.
The following two statements need to be added to your CONFIG.SYS file before you use the TRACE command:
TRACEBUF=x
- x
- is used to set the trace buffer size. Valid values are from 1 to 63 kilobytes (KB). The default size of the buffer is 4 KB.
- TRACE= ON | OFF
- Used to turn trace on or off.
If neither statement (TRACEBUF nor TRACE) is included in the CONFIG.SYS file on your system, trace is disabled.
Trace Scenario
Use the TRACE command to store trace data in the trace buffer. The following list of commands and descriptions define what happens when you use the TRACE command.
Command Entered Description of Function
- TRACE=ON
- Statement added to CONFIG.SYS
- TRACEBUF=4
- Statement added to CONFIG.SYS
- TRCUST TEST.TSF
- Creates trace information for both formatting output text and for controlling dynamic trace. For more information about the TRCUST command and its parameters, refer to the TRCUST document in the Toolkit.
- TRACE ON 240
- Turn trace ON and specify the major code for the trace points to be traced.
- TRACE ON TEST.TDF
- Modifies the .DLL file and starts dynamic trace points in the .DLL file specified in the TEST.TSF file.
- Run your program
- Perform normal system operations TEST
- TRACE OFF
- Use the TRACE command and OFF parameter to end tracing
- TRACEFMT
- Use the TRACEFMT command to format event trace buffer data.
For information about the TRACE and TRACEBUF commands, refer to the OS/2 Warp Version 4 Command Reference.
Saving Trace Data
You save trace point entries that are created within the system trace buffer in the following ways:
- Use TRACE ON to turn on all static trace points
- Use TRACE ON 220 to turn on trace points for major code 220
- Use TRACE ON PRE to turn on the trace points for the PRE grouping. There are several other groupings available.
- Use TRACE ON TEST.TDF to patch the .DLL file named in the TEST.TSF file. TRCUST uses the TEST.TSF file to create the TEST.TDF file. After the .DLL is patched, the system will save trace points when the .DLL is loaded into the system and run.
There are several other combinations of using the TRACE command. Refer to the OS/2 Warp Version 4 Command Reference for more information.
