Jump to content

PDGuide - Analyzing Performance and Debugging Problems Using Trace

From EDM2
Revision as of 13:54, 19 January 2018 by Martini (talk | contribs) (Created page with "{{PDGuide}} {{IBM-Reprint}} This chapter describes trace and the benefits of the various types of trace points. The chapter contains an overview of instrumenting (setting up...")
(diff) ← Older revision | Latest revision (diff) | Newer revision → (diff)
Problem Determination Programmer's Guide
  1. Introduction to Collecting and Managing Problem Determination Data
  2. Guide to Instrumenting Your Code
  3. Controlling FFSTProbe Calls
  4. Viewing and Analyzing Error Log Entries
  5. Analyzing Performance and Debugging Problems Using Trace
  6. Capturing and Saving Failure-Related Information through Dumps
  7. The Desktop Management Interface
  8. Summary of Functions and Interfaces
  9. Problem Determination APIs

Reprint Courtesy of International Business Machines Corporation, © International Business Machines Corporation

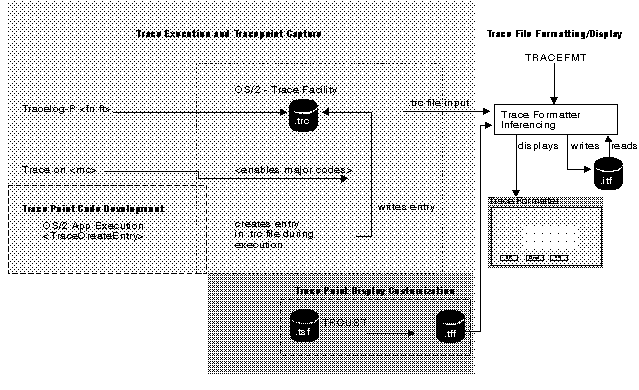
This chapter describes trace and the benefits of the various types of trace points. The chapter contains an overview of instrumenting (setting up) your code to use trace and explains how to display and analyze trace information.

This chapter also describes the following programs that are used to analyze trace information:

  • Trace Formatter (TRACEFMT)
  • Trace Commands (TRACE and TRACEBUF)
  • Trace Customizer (TRCUST)
  • Trace Capture (TRACEGET)

TraceFlow

Turning on Trace Points Using the TRACE Command

Trace Scenario

Saving Trace Data

Formatting Trace Data

Starting the Trace Formatter

Using the Trace Formatter to View, Change, and Analyze Trace Data

Menu-Bar Choices

TRACEGET Command

Summary