PDGuide - Viewing and Analyzing Error Log Entries
Reprint Courtesy of International Business Machines Corporation, © International Business Machines Corporation
This chapter assumes that you have read the information and are familiar with the defined terms in Guide to Instrumenting Your Code.
This chapter describes error logging and the error log formatter that is used to format, display, and analyze error information.
When your program encounters an error, the FFSTProbe API records information about the error in the system error log.
This chapter refers to the following types of error logs:
- Active error log
- The name of the log that is currently used. When you suspend logging, the system will not write entries to the active error log.
- Default error log
- The system uses this log after you power on the system. The system assumes this log until you specify another log to work with.
- Current error log
- The error log that a user is currently working with.
What is an Error Record?
An error record is created by the system when an error in a system or application program triggers a probe in that program. Error records contain detailed information to help you diagnose the error. Error records are also called DET1 records. Records created by a back level logging system are called DET4 records.
What is a Control Record?
A control record is created by the system when you make changes to the way errors are logged. For example, when you suspend error logging or direct error logging to a new file, the system records that change in a control record. Control records are also called DET2 records. Control records are new for FFST technology and are not available in records created by a back level logging system.
Controlling Error Logs by Using the SYSLOG Command
Use the SYSLOG command and its various parameters to access the SYSLOG utility. If you do not specify parameters when you use the command, the system loads the active system error log and displays the SYSLOG Summary window (see Working with the Error Log and Controlling Error Logging). If the system cannot find the file name you requested, SYSLOG displays a message.
If logging is not active, an error message will be shown stating
 "The OS/2 Logging Facility device driver LOG$ is not
  loaded.  To activate logging enter DEVICE=\OS2\LOG.SYS
  and RUN=\OS2\SYSTEM\LOGDAEM.EXE in config.sys and reboot.
The available parameters of the SYSLOG command are as follows:
Parameter Action
/V: <error log pathname>
- Use this parameter with the error log pathname to access the error log. If you specify no pathname, the system accesses the active error log.
/S:<error log pathname>
- Use this parameter to suspend error logging. Note that when you use this parameter, the system writes an error log entry to the current active error log that indicates that you suspended logging.
/R:<error log pathname>
- Use this parameter to resume error logging to the suspended file. If the system cannot find the pathname, the system does not resume logging. If the system finds the pathname but cannot find the error log file, the system creates the error log file and resumes logging. Note that when you use this parameter the system writes an error log entry to the current active error log that indicates that you resumed logging.
/P:<error log pathname>
- Use this parameter to redirect error logging to another error log. Note that when you use this parameter the system writes an error log entry to the current active error log that indicates you redirected logging. The error log entry contains the pathname of the error log file that logging was directed from and the pathname of the error log file that logging was directed to.
/W:xx
- Use this parameter along with the /P parameter and the error log pathname to change the maximum size (xx) of the specified error log. The default size of the error log is 64 KB.
Viewing Error Log Contents by Using SYSLOG
SYSLOG is also a function you use to view the contents of an error log entry. This function resides in the Problem Determination Tools folder.
SYSLOG supports formatting and viewing error log entries created either from the DosProbe or FFSTProbe APIs. Entries created by DosProbe will not have as much data
You can start SYSLOG by any of the following methods:
- Clicking on the SYSLOG icon that is located in the Problem Determination Tools folder of the OS2 System folder.
- Using the SYSLOG command without any parameters. The Problem Determination Users Guide in the Problem Determination Tools folder describes the SYSLOG command.
- Dragging an error log file and dropping it onto the SYSLOG icon.
If you drop multiple error log files onto the SYSLOG icon, the system starts a separate session of the formatter for each file.
You can select another error log file to view by selecting the Open... choice of the File pull-down option within SYSLOG. The active file appears as the default. You can change the file name to any other error log.
You can select which error log entry to view by double clicking on an error log entry. SYSLOG windows contain the following system error log information:
- A summary panel containing an entry for each error log record in a given error log file with limited information on each.
- One or more panels containing detailed information on specific error log entries.
- A browseable pop-up window containing the header information for the error log being viewed.
- An entry into the PM Dump Facility dump formatter tool using parameters the error log record contains.
- An entry into the trace formatter tool using the parameters that are contained in the error log record.
- An entry into the Modify Enter Collection tool used to change data-collection parameters.
In addition to its display capabilities, SYSLOG also provides controls to change the system parameters that pertain to logging. Use the controls to do the following:
- activate logging
- suspend active logging
- redirect logging
- increase the maximum size of the error log file.
The following information describes the SYSLOG Summary window and explains how you use SYSLOG to view, change, and control the error log and error log contents.
Working with the Error Log and Controlling Error Logging
When the system opens the error log, SYSLOG displays a Summary window with the following information for each error log entry:
- the date and time the system detected the error
- entry ID number
- severity of the error
- module name
- error description.
You use the Summary window to work with error logs, error log entries, and control the error-logging function.
To see all the details for each error log entry, use the horizontal slider bar. You can select Help on the menu bar for descriptions of the fields and options on the Summary window.
SYSLOGSummaryWindow
The Summary window is a snapshot of the error log. It allows selection of single or multiple entries.
Be aware that, when you use the active log, the log may change during the session if the system records another error. The error log details for a selected entry may no longer be available from the error log file if the error log wraps. When wrapping occurs, the system adds new entries at the top of the error log and erases the oldest entries. The system erases only enough old information to make room for the new for the new information. If you select an erased error entry, the system displays an error message.
The following information contains a description of the options on the Summary window.
File Choices
The File choices that are accessed from the SYSLOG Summary window are the standard OS/2 choices: Open..., Printer Setup..., and Print.
When you select the Open... choice, the system displays the Open an Error Log File window.
The system uses the default error log named LOG001.DAT when opening the error log for the first time. LOG001.DAT remains the summary log until you redirect logging to another log (see Redirect Logging).
Edit Choices
The Edit choices that you access from the SYSLOG Summary window are the standard OS/2 choices: Copy, Select All, and Deselect All.
View Choices
The View choices from the SYSLOG Summary window are Refresh Now, Header, Error Details, Search, All Records, and Active File Name. The description of the View choices follow.
View Menu-Bar Choices on SYSLOG Summary Window
Refresh Now
The Refresh Now choice updates the Summary window with any changes that occurred in the error log after you initially displayed the log. If the error log being viewed is the system's active log and logging is not suspended, the contents of the error log could change during the SYSLOG session. Values that are displayed on the Search window have no effect on the records displayed in the Summary window when you use this option. The system ignores prior search operations.
Header
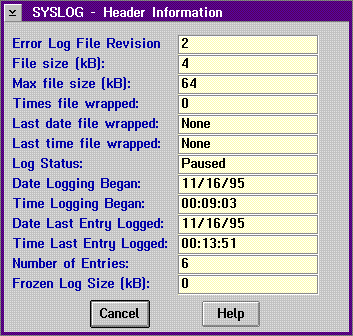
The Header choice displays the header information of the error log entry being viewed.
SYSLOG Header Information Window
Error Details
The Error Details choice displays a SYSLOG Details window that can be used to access dump and trace data and to change error-entry collections. This choice associates various tools and appears later in this chapter under the heading Displaying Error Log Entry Data.
Search Choice
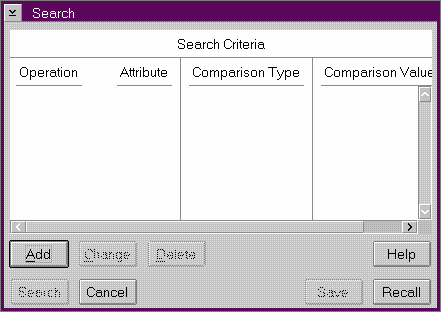
The Search choice uses your search values to select the log entries that are displayed on the Summary window. The Search choice has three associated windows: Search window, Add Criteria dialog, and Change Criteria dialog.
The Search window is a dialog window with fields for you to select, create, change, and delete search criteria. You can use search values alone (by specifying OR) or combined (by specifying AND) to provide either specific or general filtering.
Search Window
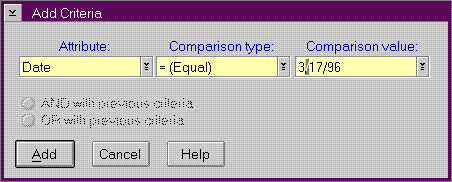
Add Criteria Dialog
Use the Add Criteria dialog to add criteria to the search for log entries. Use the three entry fields (Attribute, Comparison Type, and Comparison Value) to construct the criteria. Each entry field has a pull-down list box that contains valid values for the field. You can select an item from the list box, or enter text in the field.
The valid values for the Attribute field are:
- Date
- Time
- Entry ID
- Record type
- Severity
- Directory name
- Module
- Probe
- DMI vendor tag
- DMI tag
- Machine type
- Serial number
- User data
The Comparison Type values are the standard OS/2 values. Note that some values may not be valid with certain Attributes. For example, the Greater Than type is not valid with the Directory Name attribute. In this case, the system displays an error message box.
The Comparison Value may not always have a pull-down list box, depending on the Attribute value being selected.
Use the Change Criteria dialog to change the highlighted criteria on the Search window. It is similar to the Add Criteria dialog.
All Records
The All Records choice restores the contents of the Summary window to the previous search values.
Active Log Name
The Active Log Name choice displays the active log name, which is the error log that is currently being used for the logging of errors. This may or may not be the log you are currently viewing.
Action Choices
The Action choices from the SYSLOG Summary window are Suspend/Activate Logging, Redirect Logging, Change Log Size, and Clear Log File.
All the Action menu choices pertain to the actual collection of system error information. For each action you take, the system records the action in the appropriate error log.
Action Menu-Bar Choices on the SYSLOG Summary Window
Suspend/Activate Logging
The Suspend/Activate Logging choice causes the system to either activate or suspend the logging of errors to the current log. If logging is active when you select this option, the system suspends logging. When logging is inactive, selecting this option reactivates logging. After suspending logging, you can delete the log file and reactivate logging. The system creates a new log file with the same name as the deleted file and resumes logging to the new file.
The system writes a record entry to the current error log file for each change in logging status.
Redirect Logging
The Redirect Logging choice displays a standard file dialog for you to choose a different destination for error logging. You can select an existing log file or a new log file. If you direct logging to a log file that does not exist, the system creates the file and directs logging to the new file. The system writes an entry to the previously active error log file to indicate the change in logging status.
Change Log Size
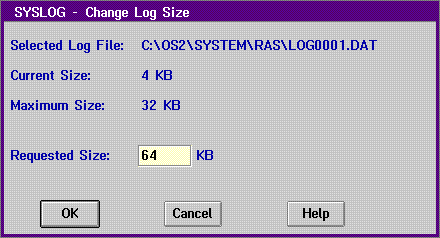
Change Log Size Window
The Change Log Size choice allows users to change the maximum size of the log file that the system allocates. You can either increase or decrease the size of the log. You cannot make the size smaller than the current size. Selecting this choice displays the path name of the system's current log file as well as any other log files that are known to the system. The system also displays the current maximum size and an input field allowing the maximum size to be changed. When complete, a message box informs the user of the new status. This choice does not change the maximum size of log files other than the selected log. The system writes a log entry to the error log file you specified to indicate the change in size.
Displaying Error Log Entry Data
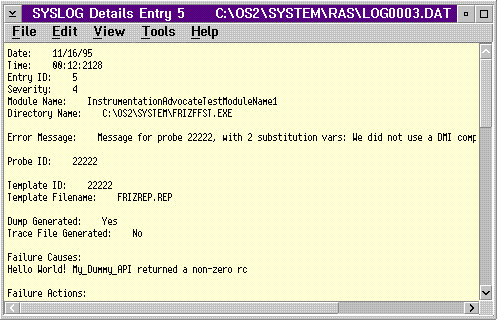
Select the Error Details choice from the View menu on the SYSLOG Summary window to display a Details screen for the selected log entry. The Details screen below shows DET1 detailed information about a log entry created using the current FFST technology. The File and Edit menu-bar choices are standard OS/2 choices.
SYSLOG DET1 Record Details Window
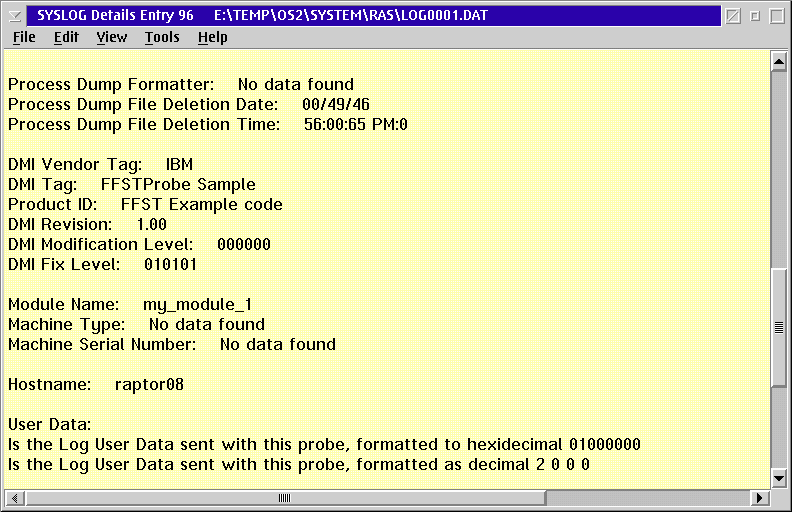
The following screen shows an example of User Data that was requested in the parameters when the FFSTProbe API was called.
SYSLOG DET1 Record User Data Info
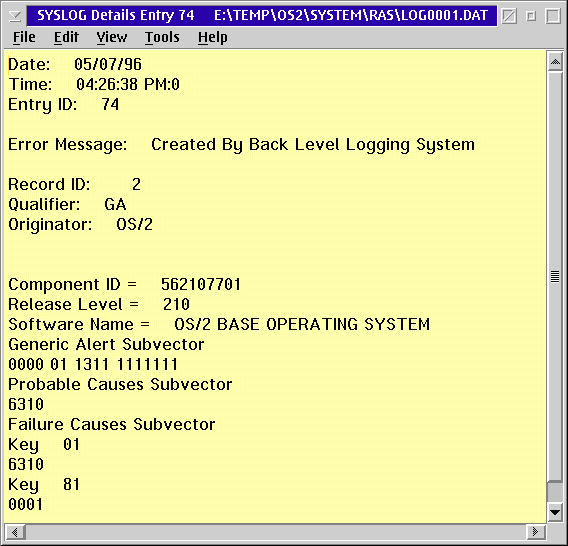
The Details screen shown below is an example of a DET4 error record detailed information created using back level FFST technology. The formats of the data may vary.
SYSLOG DET4 Record Details Window
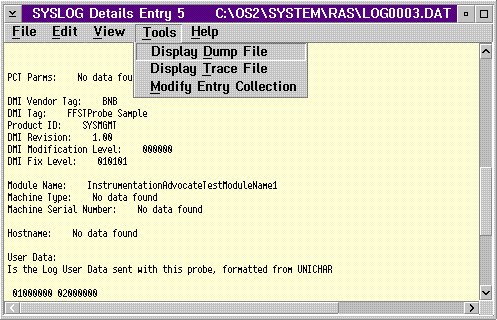
Select the Tools menu-bar choice from the Details window that is shown in Error Details to access dump and trace data and change entry collections.
Tools Menu-Bar Choices on the SYSLOG Details Window
The Display Dump File choice starts the PM Dump Facility dump formatter by using the parameters that are contained in the log record being displayed. Capturing and Saving Failure-Related Information through Dumps contains more information about dumps.
The Display Trace File choice starts the trace formatter by using the parameters that are contained in the log record being displayed. Analyzing Performance and Debugging Problems Using Trace contains more information about trace.
The Modify Entry Collection choice starts the PCT (probe control table) function of FFST. You can use the PCT tool to change options that are associated with the call to FFSTProbe that generated this log entry. For more information about the PCT function, see Probe Control Table.
Accessing Error-Log Information through Functions
You can also work with error log information through functions that provide an open interface by allowing OS/2 applications to access error log entries. These functions are:
- LogOpenFile - used to open a log file for subsequent reading.
- LogReadEntry - used to read entries from the log file. The call supports both a direct access mechanism and a log-file search mechanism.
- LogFormatEntry - used to obtain a set of ASCII or UniCode strings that you can display after formatting the log entry.
- LogCloseFile - used to close a Log File that a LogOpenFile call opened.
As described in Problem Determination APIs, these APIs can be used with either ASCII or UniCode data.
Event Notification
Each time your code calls the FFSTProbe function, the system creates an error log entry. This action is known as an event. You can request to be notified when the system records errors. The system notifies you through a process that is known as event notification.
You use an event-notification filter, a flexible data structure, to specify the type of events for notification.
The functions that are associated with event notification are:
- LogOpenEventNotification
- This function enables your product to register with the logging service so that the system notifies you when it creates specific records. You specify which log records you would like to be notified about by providing filtering information. If you do not provide filter information, the system notifies you of every entry.
- LogChangeEventFilter
- This function enables you to change the event-notification filter for a registered product. In addition to changing the filter, you can specify current event-notification filter entries for the system to delete before the filter change takes effect.
- LogWaitEvent
- After the LogOpenEventNotification function registers your product with the logging service, use the LogWaitEvent function to request notification. The system notifies you of the next error log entry that meets the registration values. The system returns the log entry into a buffer area your product specified.
- LogCloseEventNotification
- This function enables you to close event-notification requests and remove product registration with the logging service.
For more information about these functions, refer to Problem Determination APIs.
Remote Error Reporting
A local system uses remote error reporting to notify a remote managing system that an error has occurred. You must enable remote error reporting by added the /r option on the SMSTART statement in the CONFIG.SYS file.
The remote error-reporting application on the local system monitors the error log. When the system records an error, the remote error-reporting application converts the error into a Desktop Management Interface (DMI) indication and notifies the SystemView Agent of the error. The SystemView Agent converts the indication into an SNMP trap and sends the trap to a remote error-managing system. The indications that the remote error-reporting application creates are also available to local system applications through the DMI Management Interface.
As the system records errors through use of the FFSTProbe function, the remote error logging application uses the logging event-notification functions to receive the error log entries. The remote error logging application translates the entries into DMI indications. The system sends DMI indications to the DMI service-layer program. The DMI service layer forwards the indications to DMI management application programs. One of these applications, the DMI Subagent, is a SystemView program that converts the DMI indications into SNMP (Simple Network Management Protocol) traps. After conversion, the system sends the traps to an SNMP manager program that resides on a remote system. The SNMP manager receives the traps and displays error log fields so that a network administrator can read the traps to determine appropriate action.
The current implementation translates a Unicode-format error log entry into an ISO8859-1 format DMI indication. The system changes any Unicode characters that cannot be displayed in ISO8859-1 to a period (.).
Building and Sending an Indication
When the remote error reporting application receives an entry from the error log, it translates the entry into a DMI indication. An error log entry contains multiple fields of information that describe the error being logged. The remote error reporting application translates several of the fields into DMI attributes. The attributes match the remote error-reporting System Management Information Format (MIF) the system installed in the DMI MIF database.
The DMI indication sends only a portion of the error log entry. The indication contains a total of 17 attributes from three error groups. The IBM Event Indication group contains general attributes that identify the error. The FFST Error and OS/2 Software groups contain fields that provide specific information. For more detail of these error groups, view the remote error-reporting MIF (REMOTERR.MIF).
Because the lengths of some attributes can be as long as 508 bytes. The indication, once converted into an SNMP trap, could exceed the maximum length of 4096 bytes. Normally indications do not exceed the maximum size.
The system sends DMI indications for Only error records with severity of the following levels: critical error, major error, and minor error.
For additional information that is related to remote error reporting, refer to SystemView Agent User's Guide and the SystemView Agent Programmer's Guide.


